Using Attributes to Improve the Quality and Usability of Your Code Part 2 - Improving Debugging
I am a big fan of attributes in .NET. Ever since I discovered them in .NET 1, I have been digging in the MSDN documentation to find more useful attributes that I can use to improve the quality of the code I write and design. With the release of .NET 2, the number of attributes has increased quite a bit. During my search I discovered a number of useful attributes that have helped me write better code so I thought it was time for a short article series about attributes. This installment, Part 2 - Improving Debugging shows you a number of useful attributes that you can apply to elements like methods and classes to improve your debugging experience.
Read Part 1 - Decorating Business Objects for Data Binding
Visual Studio always has had great support for debugging, and the new 2005 series of products are no exception. You simply set a breakpoint somewhere in your code, hit F5 to start up the application and whenever the breakpoint is hit, the application halts and you get a chance to debug your code, diagnose (and change) your variables, objects, controls and so on. However, there are times where the default offerings in debugging are not enough. In this article, I'll show you how to apply a few attributes to make your code much easier to debug. Just as with the previous article, I'll use a modified version of the Bug class from chapter 12 - The Bug Base from my latest book: ASP.NET 2.0 Instant Results. Below you find the class diagram for the Bug class that shows its properties and methods. For more details about the class, refer to Part 1 of this article series.
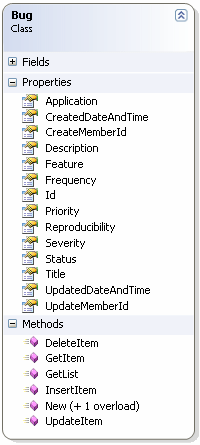
Figure 1 - The Bug Class
Applying Attributes to Code You Don't Want to Debug
When you step through your code using F10 or F11 you may accidentally end up in a block of code like a method that you don't want to debug. Good examples of this are tried and tested methods and properties in your application. However, if you don't switch between F10 and F11 at the right moment, you may accidentally step into such a method. Fortunately, there are a few attributes you can apply to your code to tell the debugger you don't want to step into it. Let's take a look at an example; the code below shows the ConnectionString property for the BugBase application, without any attributes:
VB.NET
Public Shared ReadOnly Property ConnectionString() As String
  Get
    Dim tempValue As String = "server=(local)\SqlExpress;AttachDbFileName=" & _
        "|DataDirectory|BugBase.mdf;Integrated Security=true;User Instance=true"
    Try
      If ConfigurationManager.ConnectionStrings("BugBase") IsNot Nothing Then
        tempValue = _
            ConfigurationManager.ConnectionStrings("BugBase").ConnectionString
      End If
    Catch ex As Exception
        ' When we can't get the settting from the config file, ignore the error
        ' and return  the default connection string that points to the instance
        ' SqlExpress on the local machine and tries to attach the database
        ' BugBase automatically.
    End Try

    Return tempValue
  End Get
End Property
Every time you're debugging some code that accesses this property, you may accidentally step into its Get or Set accessor. However, you know this property works fine when you have used and debugged it a few times, so there really isn't a need to step into it every time. To completely ignore the attribute when debugging, you can apply the DebuggerStepThroughAttribute attribute to either the Get or Set accessor of the property, or to both. For this attribute (and others mentioned in this article) you need to import the namespace System.Diagnostics in your class.
VB.NET
Public Shared ReadOnly Property ConnectionString() As String
  <DebuggerStepThroughAttribute()> _
  Get
    ' Implementation Here
  End Get
End Property

C#
public string ConnectionString
{
  [DebuggerStepThroughAttribute()]
  get
  {
    // Implementation here;
  }
}
Although the DebuggerStepThroughAttribute prevents you from stepping into the method's body, you can still set an explicit breakpoint in the code. You can only debug code with explicit breakpoints set in the method's body, so as soon as you hit F11, you're back in the calling code.
If you want an element like a method to be completely ignored, even with explicit breakpoints set on them, you can use the DebuggerHiddenAttribute like this:
VB.NET
Public Shared ReadOnly Property ConnectionString() As String
<DebuggerHiddenAttribute()> _
  Get
    ' Implementation Here
  End Get
End Property

C#
public string ConnectionString
{
  [DebuggerHiddenAttribute()]
  get
  {
    // Implementation here;
  }
}
Notice that on a default installation of Visual Studio 2005 you won't see the difference between DebuggerStepThroughAttribute and DebuggerHiddenAttribute. This is caused by the "Just My Code" feature which is on by default. To turn off this feature, choose Tools | Options and then open the Debugging category:
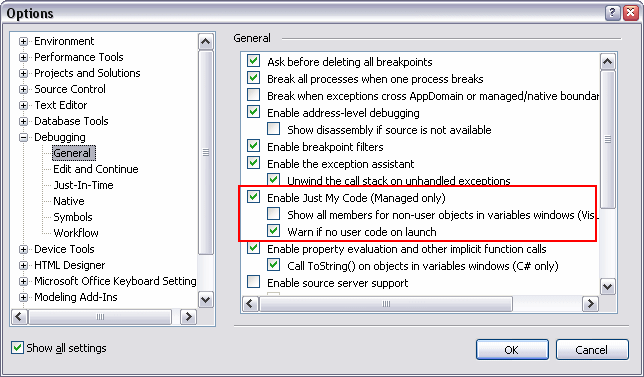 Figure 2 - The Options Dialog for Debugging Settings in Visual Studio 2005
You can use the DebuggerNonUserCodeAttribute to create a combination of the DebuggerHidden and DebuggerStepThrough attributes.
Improving the Information You See in the Debugger
By default, when you view one of your own classes in the debugger, you only see its fully qualified type name, as depicted in the following image:
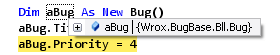
Figure 3 The Default Visualizer for the Bug Class
When you hover your mouse over a variable like aBug, a default visualizer pops up that shows the name of the object, and its fully qualified name, Wrox.BugBase.Bll.Bug in this case. You can click the + symbol in front of the object's name to see detailed information about the item you're debugging.
However, it would be much more useful if you'd see a little bit more information about the bug itself, instead of its name, without expanding the object's visualizer. To enhance the Bug class so it shows more useful information, you can use DebuggerDisplayAttribute. This attribute allows you to define a string with a number of placeholders that are replaced at run-time. To see how this works, look at the following example:
VB.NET
<DataObjectAttribute()> _
<DebuggerDisplayAttribute("Bug: {Title} Priority: {Priority}")> _
Public Class Bug

End Class

C#
[DataObjectAttribute()]
[DebuggerDisplayAttribute("Bug: {Title} Priority: {Priority}")]
public class Bug
{

}
The parts between the curly brackets are placeholders that, in this case, hold the names of public properties of the Bug class. At run-time, these placeholders will be replaced with the actual value of the property, providing you with useful information about the object. The rest of the text between the quotes is treated as literal text. The following picture shows how the visualizer for the Bug now shows its Title and its Priority
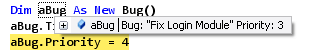
Figure 4 The Visualizer for the Bug Class Providing Additional Information
You're not limited to just static text and placeholders; the string that you pass to the constructor of the DebuggerDisplayAttribute attribute also allows you to embed custom expressions. The DebuggerDisplayAttribute page on MSDN shows you how to embed expressions.
The previous code example also shows that it's easy to combine multiple attributes. In VB.NET, you can use the underscore as a line continuation character to give each attribute its own line; in C# you can simply add each attribute on its own line.
Notice that, by default, when a class overrides the ToString() method, the output of that method is used in the visualizer when you haven't applied the DebuggerDisplayAttribute attribute. This works in C# only, and only if the option is turned on (it is by default) in Visual Studio. Figure 2 in this article shows that option called Call ToString() on objects in variables windows (C# only), right below the red rectangle.
It's pretty easy to customize this visualizer even further, or write our own. The article DataTips, Visualizers and Viewers Make Debugging .NET Code a Breeze on the MSDN site is a nice starting point to learn more about visualizers.
There are a couple of other useful attributes that can aid in improving your debugging experience. Check out the System.Diagnostics namespace for more information.
Are you using special attributes to decorate the elements you code that increase your productivity? Leave a comment at the end of this article, so others can benefit from your knowledge as well.
Where to Next?
Wonder where to go next? You can post a comment on this article.
Links in this Document
| Doc ID | 391 |
| Full URL | https://imar.spaanjaars.com/391/using-attributes-to-improve-the-quality-and-usability-of-your-code-part-2-improving-debugging |
| Short cut | https://imar.spaanjaars.com/391/ |
| Written by | Imar Spaanjaars |
| Date Posted | 05/13/2006 20:51 |
| Listened to when writing | Wish You Were Here by Incubus (Track 3 from the album: Morning View) |
Comments
Talk Back! Comment on Imar.Spaanjaars.Com
I am interested in what you have to say about this article. Feel free to post any comments, remarks or questions you may have about this article. The Talk Back feature is not meant for technical questions that are not directly related to this article. So, a post like "Hey, can you tell me how I can upload files to a MySQL database in PHP?" is likely to be removed. Also spam and unrealistic job offers will be deleted immediately.
When you post a comment, you have to provide your name and the comment. Your e-mail address is optional and you only need to provide it if you want me to contact you. It will not be displayed along with your comment. I got sick and tired of the comment spam I was receiving, so I have protected this page with a simple calculation exercise. This means that if you want to leave a comment, you'll need to complete the calculation before you hit the Post Comment button.
If you want to object to a comment made by another visitor, be sure to contact me and I'll look into it ASAP. Don't forget to mention the page link, or the Doc ID of the document.